Live Dashboard
Use the Zone Configurator live dashboard to view presence sensor data and monitor your configured room.
The Live Dashboard is your main view for watching real-time presence detection. See targets move, monitor zone status, and verify your sensor is working correctly.
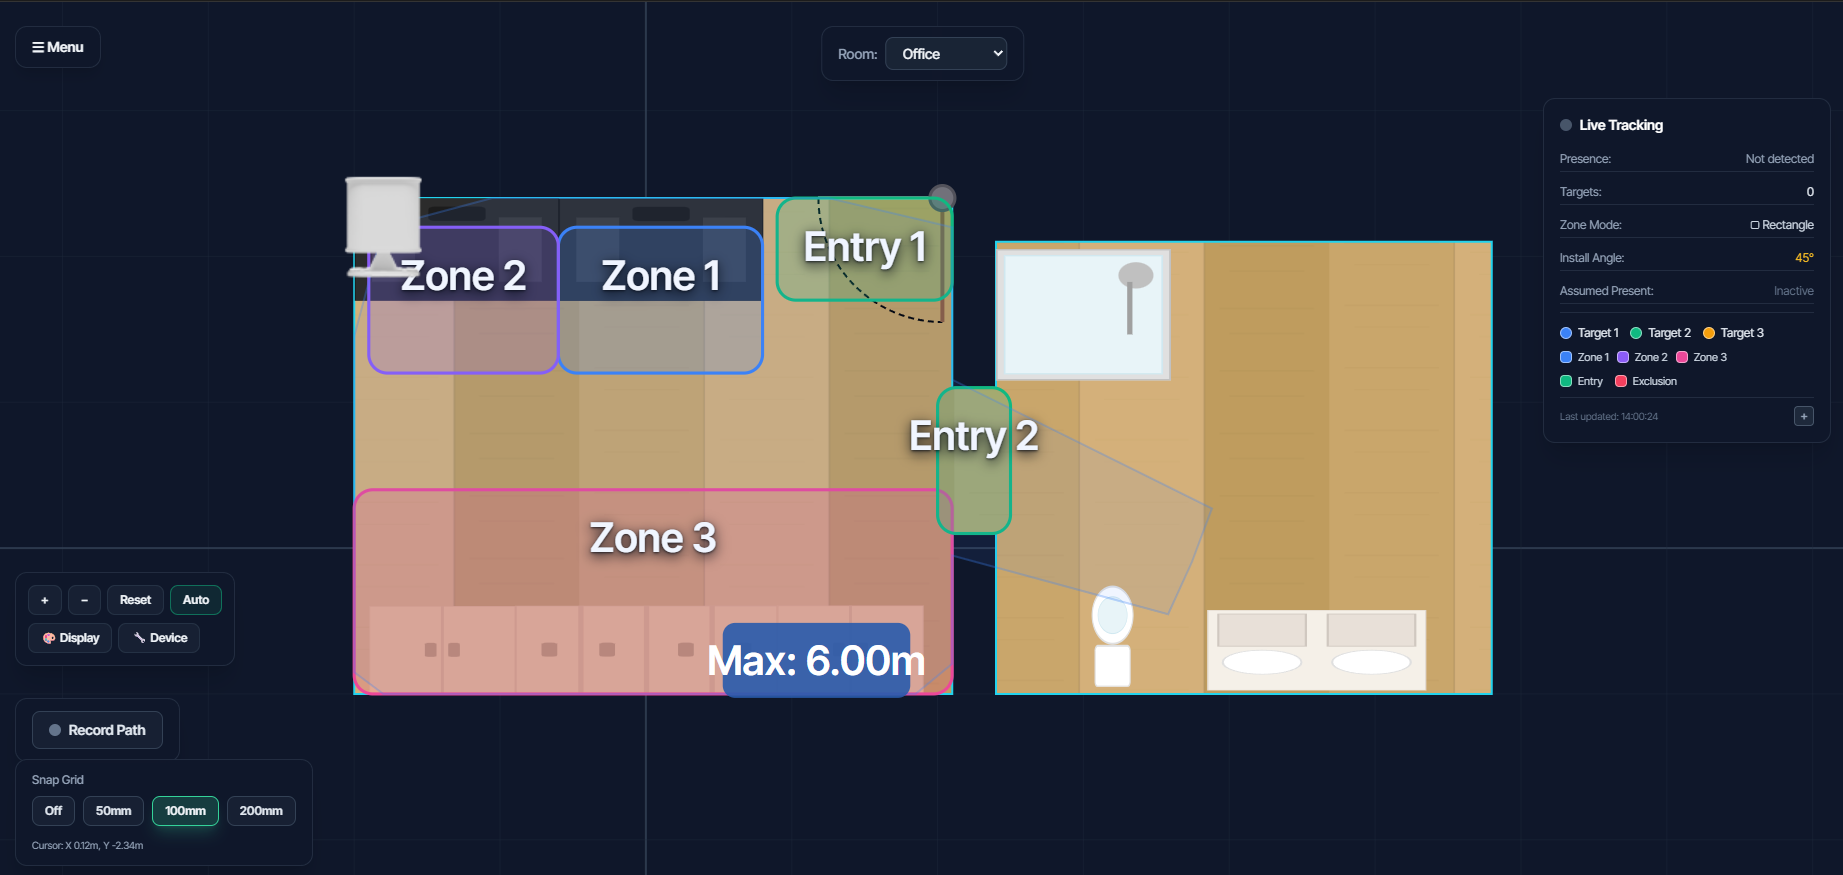
Dashboard Overview
The dashboard displays:
- Room layout with walls, doors, and furniture (if configured)
- Detection zones you've created
- Target dots showing detected people/objects
- Device position and field-of-view cone
- Real-time status indicators
Understanding the Radar View
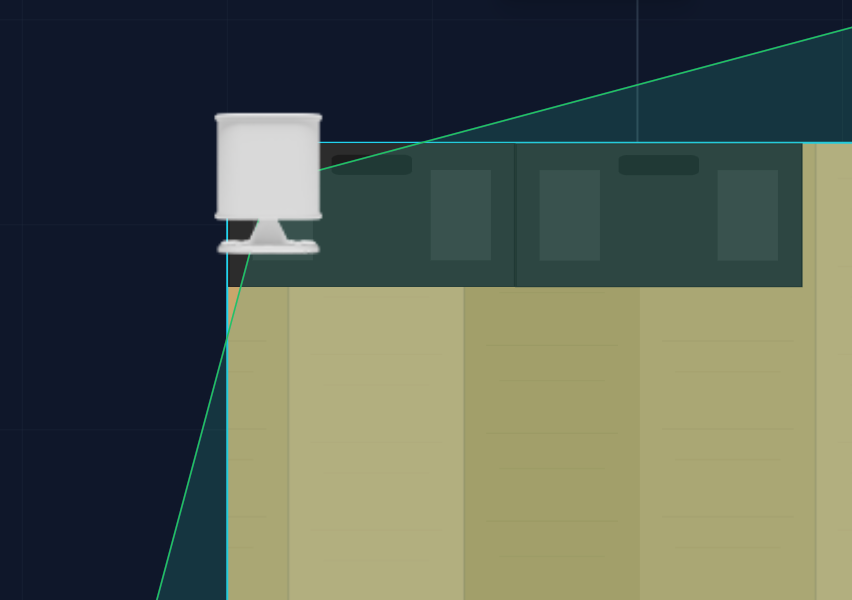
Device Icon
The sensor icon shows where your device is positioned. The cone extending from it represents the field of view (detection area).
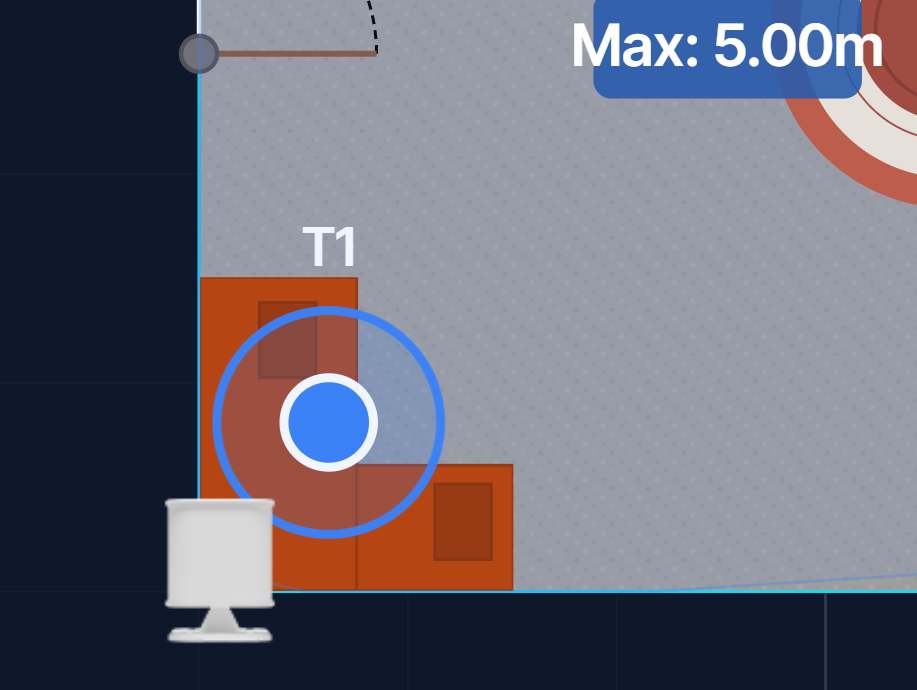
Target Dots
Each detected target appears as a coloured dot:
- Dots move in real-time as targets move
- Trails show recent movement path (fades over time)
- Multiple targets are tracked simultaneously (EPL and Pro)
Zones
Zones appear as coloured rectangles or polygons:
- Blue zones - Regular detection zones
- Red zones - Exclusion zones (masks)
- Green zones - Entry zones
- Zone highlights when occupied
Status Indicators
Target Count
Shows how many targets are currently detected. Located in the status bar.
Zone Occupancy
Each zone shows its current state:
- Occupied - Target detected inside zone
- Clear - No targets in zone
Environmental Readings (EP1 Only)
EP1 devices display additional sensor data:
- Temperature
- Humidity
- Illuminance (light level)
- CO2 (if module installed)
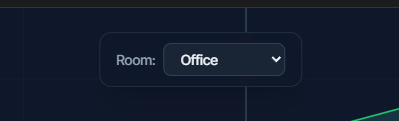
Room Selector
If you have multiple rooms configured, use the room selector dropdown to switch between them.
Navigation Menu
Click the menu icon (☰) to access:
| Option | Description |
|---|---|
| Zone Editor | Create and edit detection zones |
| Room Builder | Modify room layout |
| Heatmap | View presence patterns over time |
| Recording | Record tracking sessions |
| Settings | Configure options and manage rooms |
| Add New Device | Set up another sensor |
Connection Status
The connection indicator shows:
- Green - Connected and receiving data
- Yellow - Connecting...
- Red - Disconnected (check device status)
If disconnected, verify:
- The device is powered on
- Home Assistant can reach the device
- The add-on is running
Tips for Using the Dashboard
- Walk around the room to verify tracking accuracy
- Check zone activation by entering each zone
- Adjust device position if tracking seems offset
- Use Room Builder to add obstacles that may affect detection
Next Steps
- Zone Editor - Create detection zones
- Room Builder - Add room details
- Heatmap & Analytics - View presence patterns