Heatmap & Analytics
Explore heatmaps and analytics in Zone Configurator to understand detected activity and movement in your room.
The Heatmap feature visualizes presence patterns over time, showing you where people spend the most time in a room. Use this data to optimize zone placement and understand room usage.
Note: Heatmap is available for Everything Presence Lite (EPL) and Everything Presence Pro devices.
Accessing the Heatmap
- From the Live Dashboard, click the menu icon (☰)
- Select Heatmap
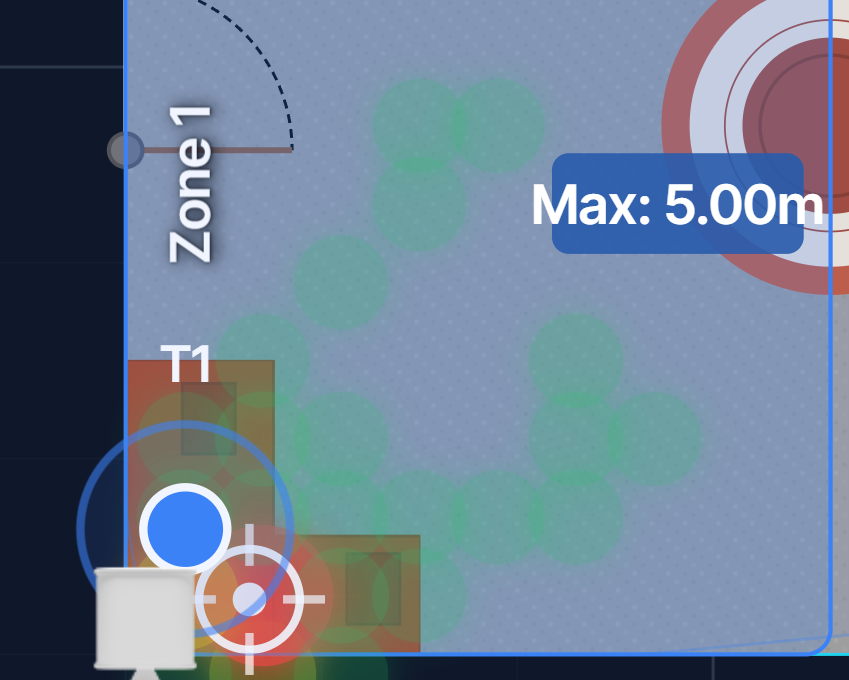
Understanding the Heatmap
Color Scale
The heatmap uses colors to show presence intensity:
| Color | Meaning |
|---|---|
| Blue/Purple | Low presence (rarely occupied) |
| Green | Moderate presence |
| Yellow | High presence |
| Orange/Red | Very high presence (frequently occupied) |
What It Shows
The heatmap displays accumulated presence data over the selected time period. Areas where targets are detected more frequently appear "hotter" (warmer colors).
Time Period Selection
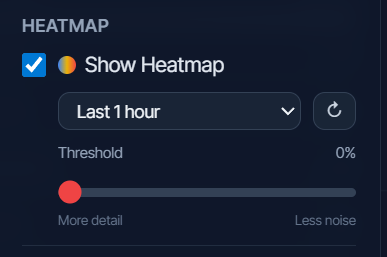
Choose the time range for your heatmap data:
| Period | Description |
|---|---|
| Last Hour | Recent activity snapshot |
| Last 24 Hours | Full day overview |
| Last 7 Days | Weekly patterns |
| Last 30 Days | Monthly usage trends |
| Custom Range | Select specific start/end dates |
Hourly Activity Chart
Below the heatmap, an activity chart shows presence levels by hour:
- X-axis: Hours of the day (0-23)
- Y-axis: Presence intensity
- Bars: Average activity level for each hour
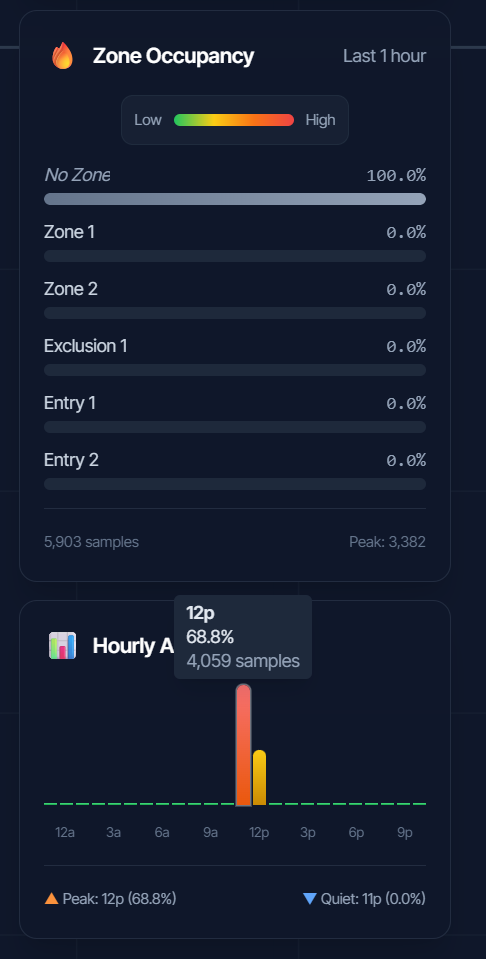
This helps identify:
- Peak usage times
- Quiet periods
- Daily patterns
Interpreting the Data
High Activity Areas
Hot spots (red/orange) indicate:
- Frequently occupied locations
- Primary seating or work areas
- High traffic pathways
Action: Ensure these areas have reliable zone coverage.
Low Activity Areas
Cold spots (blue/purple) indicate:
- Rarely used spaces
- Possible detection blind spots
- Areas blocked by furniture
Action: Consider if these areas need zones, or if sensor repositioning would improve coverage.
Traffic Patterns
Trails of moderate activity often show:
- Walking paths through the room
- Routes between entry points and seating
- Movement between activity zones
Use Cases
Optimizing Zone Placement
- View heatmap for the past week
- Identify where people actually spend time
- Adjust zones to match real usage patterns
- Remove zones from unused areas
Identifying Dead Zones
- Compare heatmap to expected room usage
- Look for unexpectedly cold areas
- Check if furniture or obstacles block detection
- Consider repositioning the sensor
Understanding Room Usage
- View activity by time of day
- Identify peak hours for different areas
- Use insights for automation timing
- Optimize lighting schedules based on actual patterns
Debugging False Triggers
- Look for unexpected hot spots
- Check areas near windows or walls
- Identify reflection or interference sources
- Add exclusion zones where needed
Data Collection
How Data Is Collected
- Target positions are sampled periodically
- Position data is aggregated into grid cells
- Cell counts accumulate over time
- Data is stored locally in the add-on
Data Retention
Heatmap data is retained based on the selected time period. Older data may be automatically pruned to manage storage.
Privacy Note
All heatmap data stays local to your Home Assistant instance. No data is sent externally. The heatmap shows aggregate patterns, not individual tracking.
Clearing Heatmap Data
To reset the heatmap and start fresh:
- Open Settings
- Find Clear Heatmap Data
- Select the room to clear
- Confirm the action
Note: This permanently deletes historical presence data for the selected room.
Tips for Better Heatmaps
- Let it collect data - Heatmaps are most useful after several days of data
- Check multiple time ranges - Daily vs weekly patterns may differ
- Compare before/after - After moving zones or the sensor, compare heatmaps
- Use with Room Builder - Overlay helps identify furniture-related blind spots
Next Steps
- Zone Editor - Adjust zones based on heatmap insights
- Room Builder - Add furniture to understand coverage
- Recording & Playback - Debug specific tracking issues